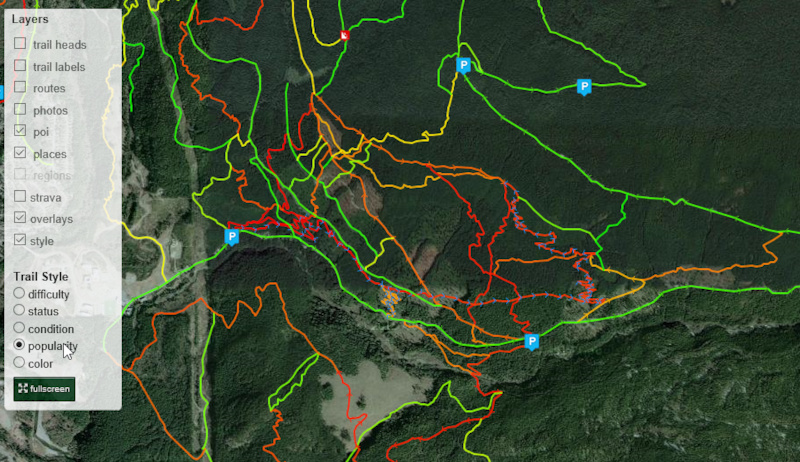
The map has several options for displaying trails, the default is by trail difficulty colour. One of the options is "popularity", which will colour the trails based on a colour heatmap.
The range is green to yellow to orange to red. Green being the least ridden trail, red being the most.
This popularity data is calculated based on users ridelog data from the past year and relative to only the trails in the same region.
The region is all trails in the same city.
Trails are ranked on a 1-100 scale based on how much their ridden. A different green-red colour is assigned to every 5 steps in the 1-100 scale, so there will be up to 25 colours on the heatmap.
Hidden trails are included in this ranking, but regular users without regional permissions still cannot see them on the map.
- By canadaka
 Trailforks
 - #60 - 83,381 views